
Cycle Time · Manual Welding Cell 4A
per chassis weld cycle

Cycle Time · Robotic Cell 4A
per chassis weld cycle
67% faster · 99.997% defect-free · 14-month payback
The numbers are already on your floor. We just make them better.
Avg Uptime
23-hr production days
Repeat Accuracy
Sub-hair tolerance
Cells Deployed
Across 34 countries
Avg Payback
Full ROI period
Defect Rate
vs 2.8% manual avg
Cycle Time ↓
Median improvement
Verified Case Studies · 2023–2026
Three verticals.
One conclusion.
Evidence Stack
Each case study below uses actual production data from named clients. Metrics verified by third-party industrial auditors.

Dortmund Chassis Systems · Bochum, Germany
From 94-second weld cycles to 31 — on the same floor, same fixtures.
−67%
Cycle time
−99.9%
Defect rate
−83%
Operators

Apex Circuit Assembly · Penang, Malaysia
PCB inspection throughput doubled. Zero-escape defects for 8 consecutive months.
+112%
Inspection rate
−100%
Escape defects
−97.5%
False rejects
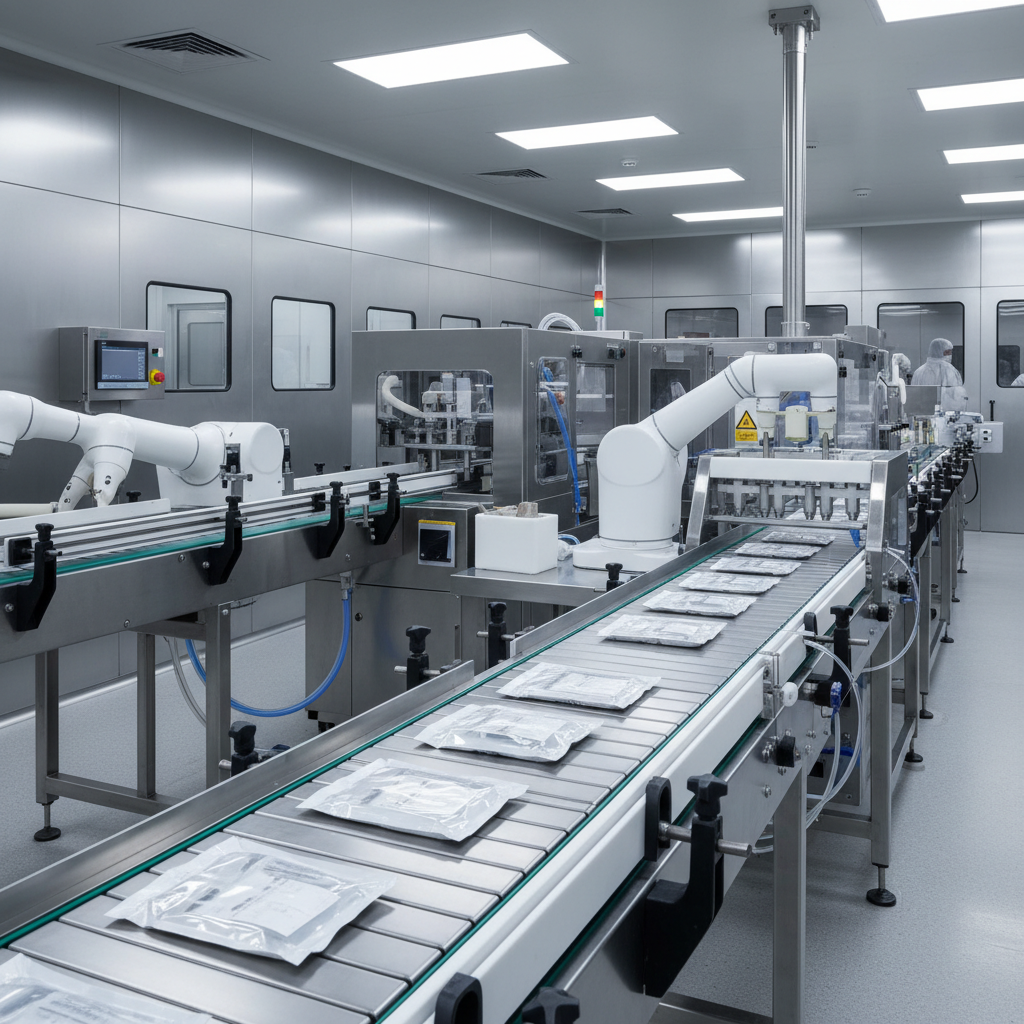
Nordvik Consumer Foods · Malmö, Sweden
Throughput doubled. No new headcount. FDA 21 CFR Part 11 compliance on day one.
+105%
Cases / hr
+23.2pp
Line efficiency
−99.1%
Mispack rate
Fleet Intelligence · 2,847 Active Cells
The aggregate truth
from every floor we've touched.
These aren't projections. They're the arithmetic average of 2,847 deployed cells across 34 countries, updated quarterly from live MES integrations.
Average Payback Period
Across all 2,847 deployments
Avg Cycle Time Reduction
Median improvement vs. manual baseline
Cumulative Defects Prevented
Units since 2019 fleet data
Customer Reorder Rate
Clients who expanded deployment
Fleet Uptime (24-mo avg)
Across all active cells globally
Avg Labor Cost Reduction
Per-cell, year-1 vs. pre-deployment
Typical Payback Timeline · Single Cell Deployment
Product Line · 2026
Three arms.
Every vertical covered.
Specification
AX-3 Precision
Electronics / Medical
AX-4 Hygienic
Food & Beverage
AX-6 Weld
PopularAutomotive / Heavy Mfg
Payload
2 kg
5 kg
12 kg
Reach
600 mm
800 mm
1,850 mm
Repeat Accuracy
±0.02 mm
±0.04 mm
±0.04 mm
Configuration
3-axis delta
4-axis SCARA
6-axis articulated
Max Cycles
180 cycles/min
120 cycles/min
62 cycles/min
IP Rating
IP65
IP69K
IP67
AX-3 Precision
Electronics / Medical
Payload
2 kg
Reach
600 mm
Repeat Accuracy
±0.02 mm
Configuration
3-axis delta
Max Cycles
180 cycles/min
Protection
IP65
AX-4 Hygienic
Food & Beverage
Payload
5 kg
Reach
800 mm
Repeat Accuracy
±0.04 mm
Configuration
4-axis SCARA
Max Cycles
120 cycles/min
Protection
IP69K
AX-6 Weld
Automotive / Heavy Mfg
Payload
12 kg
Reach
1,850 mm
Repeat Accuracy
±0.04 mm
Configuration
6-axis articulated
Max Cycles
62 cycles/min
Protection
IP67
Free Tool · No Demo Required
Calculate your floor's
actual payback period.
Input your current cycle time, defect rate, and headcount. The calculator returns a production-grade ROI model — the same one our application engineers use on-site. Takes 90 seconds.
Your floor is already
the next case study.
Three verified throughput improvements. Three different verticals. One consistent outcome. The configurator takes 8 minutes and returns a production-ready cell specification with a quoted delivery date.
Automotive
−67% cycle time
Dortmund Chassis Systems
Electronics
+112% throughput
Apex Circuit Assembly
Food & Bev
+105% cases/hr
Nordvik Consumer Foods
No sales call until you request one · ISO 9001:2015 · 6-week avg deployment